Python Client
Our open-source quakesaver-client allows easy access to all data of your entire sensor fleet. You can query what sensors you have in your database and download the raw waveform data as well as the metadata straight from the sensor.
The higher level dataproducts such as Spectral Intensity, JMA Intensity, Peak Acceleration/Velocity data and many more can be access with only few lines of python code. Queries for these also allow applying rolling mean, max, min aggregators with a configurable window length.
TIP
Checkout the documentation for further info.
Example
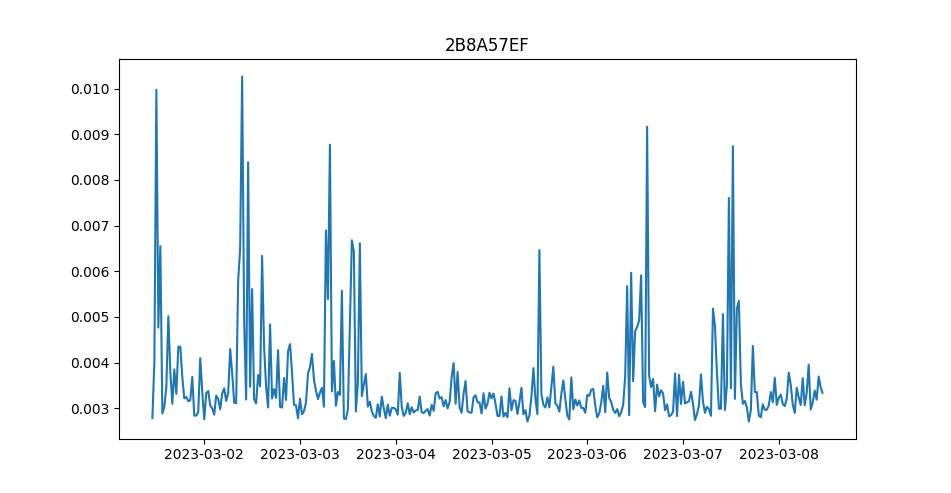
This example downloads 5 hours of Peak Horizontal Acceleration data with a rolling max of 30 minutes.
TIP
This also works with the demo user login. If you don't have one, let us know.
python
from datetime import datetime, timedelta
from quakesaver_client import QSClient
from quakesaver_client.models.measurement import MeasurementQuery
import matplotlib.pyplot as plt


# Use your standard login credentials from network.quakesaver.net
client = QSClient(email="USERNAME", password="SUPERSECRETPASSWORD")

# A list of sensor IDs that I have access to
ids = client.get_sensor_ids()

# Get the digital twin of the first sensor in the list
sensor = client.get_sensor(ids[0])

# Setup a time window e.g. of the last 7 days
end_time = datetime.utcnow()
start_time = end_time - timedelta(days=7)

# Create a query with the time range and a rolling max of 30 minutes
query = MeasurementQuery(
    start_time=start_time,
    end_time=end_time,
    interval=timedelta(minutes=30),
    aggregator="max",
)
result = sensor.get_peak_horizontal_acceleration(query)

plt.plot(result.data.times, result.data.values)
plt.title(result.sensor_uid)
plt.show()